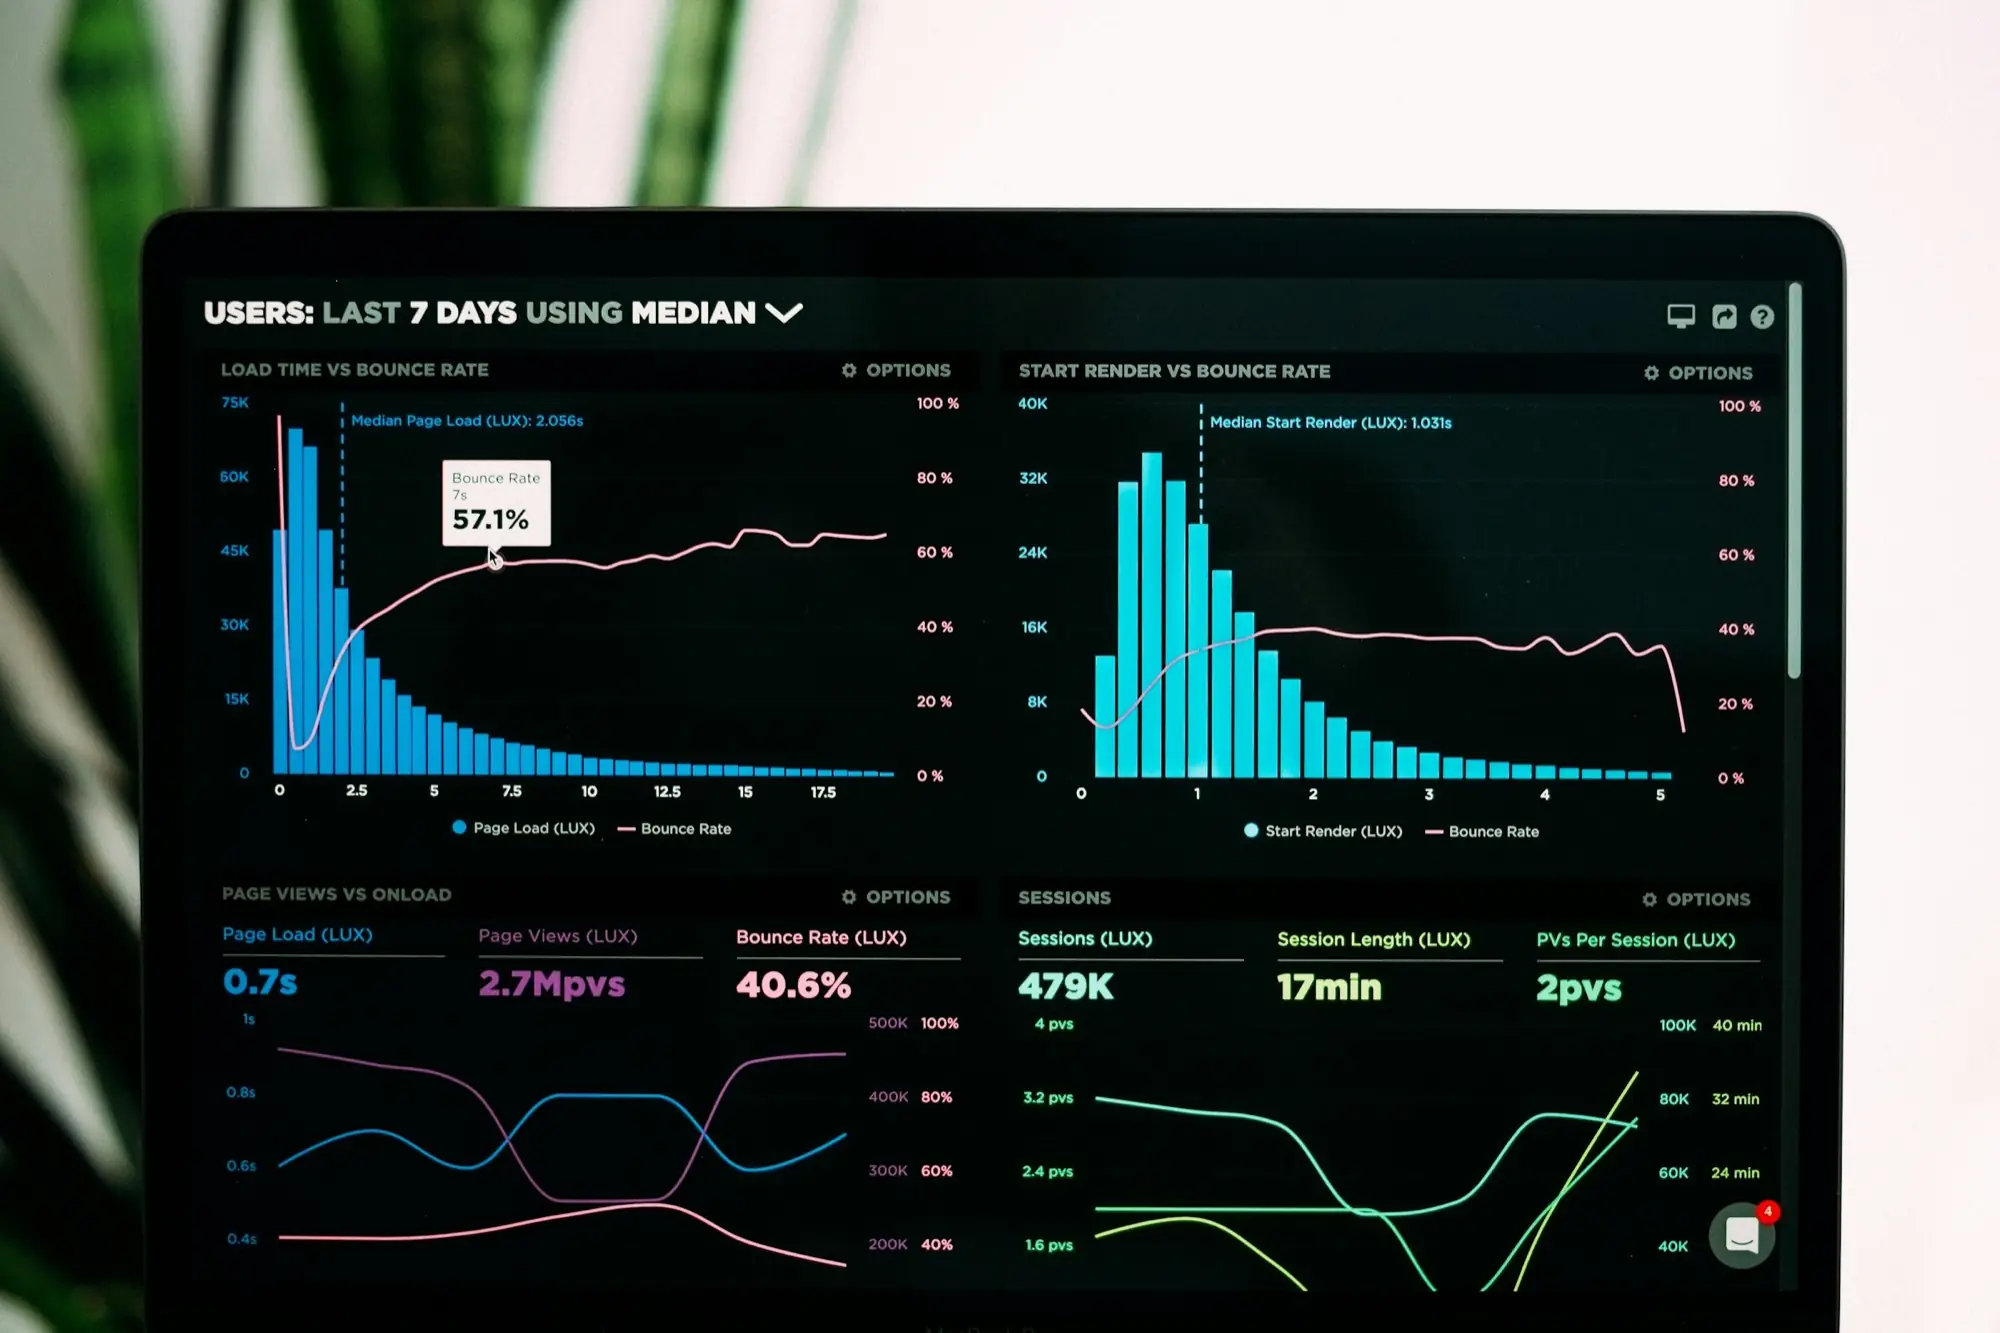
Generation, availability and loss reports, on demand.
Turn live plant data into the reports owners, lenders and grid operators ask for, with charts and dashboards tailored to how you run your portfolio.
What reports does a wind farm SCADA produce?
A wind farm SCADA turns raw turbine data into three core reports: generation (how much energy each turbine and site produced), availability (how much of the time the machines and the grid were able to produce) and losses (energy lost to faults, downtime or grid issues, and why). Rook SCADA produces all three on demand for wind and solar plants, alongside custom charts and dashboards.
Reports built from live data, not spreadsheets
The numbers come straight from the plant, so nobody spends the first week of the month copying readings.
-
01
Generation reports
Energy produced per turbine, inverter, site or portfolio, for the period you choose.
-
02
Availability reports
Track how much of the time machines and the grid were available, and hold OEM and O&M contracts to account.
-
03
Loss reports
See where energy was lost — faults, downtime, grid issues — and which problems are worth fixing first.
-
04
Charts and trends
Visualise performance over time to spot slow declines that a single daily number hides.
-
05
Tailor-made dashboards
Dashboards, reports and charts are engineered to your operational requirements, not a fixed template.
-
06
Straight to owners
Generation reports reach owners directly through the same category routing used for alarms and warnings.
How reports are produced
From the turbine controller to a report you can send.
-
01
Collect
Live data arrives from every turbine and inverter through the Rook RTU.
-
02
Store
Rook’s server keeps the history, so any past period can be reported.
-
03
Calculate
Generation, availability and losses are worked out per asset, site and portfolio.
-
04
Report
Reports and charts are produced on demand and shared with the people who need them.
Reporting terms, explained
The words that come up in every generation review, in plain language.
- Generation
- The energy a turbine, inverter or plant produced over a period, usually in kWh or MWh.
- Machine availability
- The share of time the turbine or inverter itself was able to operate, excluding outages caused outside the machine.
- Grid availability
- The share of time the grid was able to accept the plant’s power. Separating it from machine availability shows who caused a loss.
- Generation loss
- Energy that could have been produced but wasn’t, because of faults, downtime, grid outages or curtailment.
- Capacity utilisation factor (CUF)
- Energy actually produced, as a percentage of what the plant would produce at full rated capacity over the same period.
Reports & Charts: common questions
Generation, availability and loss reports on demand, plus charts and dashboards tailored to your operational requirements.
Machine availability measures how much of the time the turbine itself was able to run. Grid availability measures how much of the time the grid could accept its power. Separating the two shows whether lost generation was the machine’s fault or the grid’s.
Yes. Rook’s solution is engineered to each client’s requirements, including dashboards, reports, charts and user access.
Yes. Generation, availability and loss reporting covers solar inverters and strings as well as wind turbines.
Yes. Rook’s solution complies with CEA and SLDC requirements and shares real-time data with the state SLDC. Rook is a recognised data aggregator for the Tamil Nadu SLDC.
Other Rook SCADA solutions
-

Real-time Monitoring

Live turbine and plant telemetry, streamed to any device.
-

Remote Control
Start, stop and change setpoints from wherever you are.
-

Alarms & Warnings
Prioritised fault alerts with a full acknowledgement trail.
-

OEM Compatibility
Plug-and-play integration with leading wind OEMs.
-

Rook RTU
Our own RTU hardware, with SIM-based links or fibre.
Last updated